
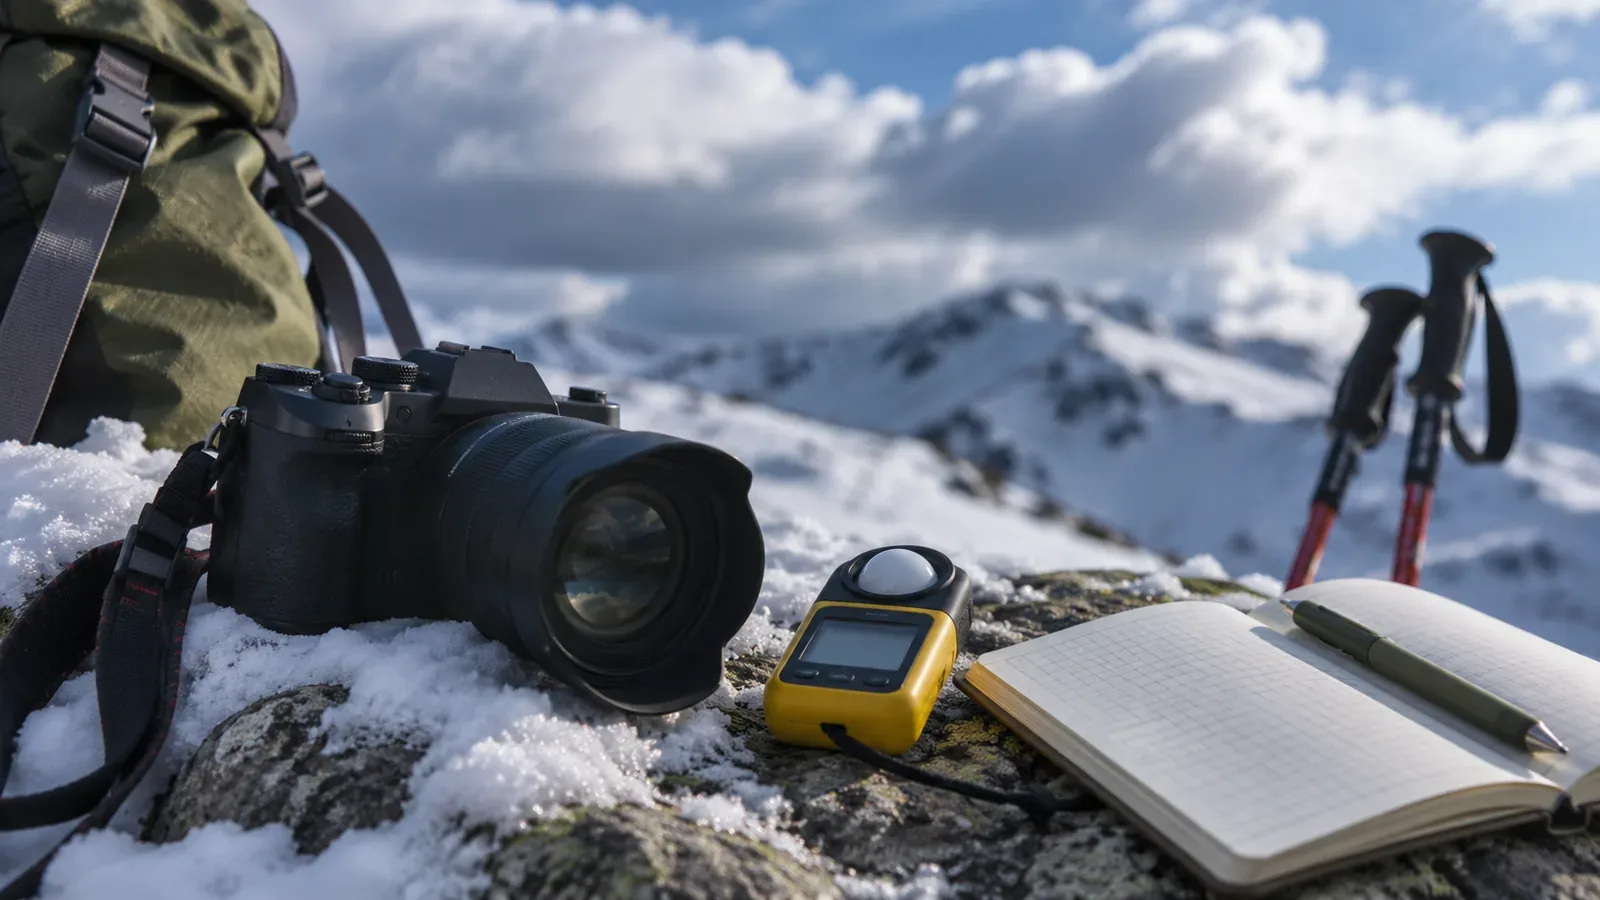
Consider the settings that make snow look bright in a photo separately from UV protection. Japan’s environment ministry explains that snow reflection can increase exposure. A photo or screen cannot tell you the amount. Use the photo to record the place and snow conditions and the UV information to understand intensity for the area and time.
Visible glare and the UV you receive are different
The ministry’s handbook explains that infrared radiation makes sunlight feel warm and people cannot sense the UV that causes sunburn. On a cold, snowy mountain, the warmth you feel on your skin gives little information about UV. The handbook cites WHO guidance that calls for particular care if UV is strong even on cool days in early spring.
Glare, warmth and the brightness of a photo cannot show how much UV you receive. Glare is your impression of visible light. Photo brightness results from the camera and display. The Japan Meteorological Agency uses the UV index, an international scale of UV intensity based on effects on people. The agency notes that the WHO recommends using it to plan protection. The ministry’s handbook lists measures for each level.
What snow adds and what else affects UV
The ministry’s handbook gives examples such as 80% reflectance for fresh snow and explains that, over snow, reflected UV adds to radiation from above. The figure illustrates reflection and does not mean the same exposure on every snow surface or when facing every direction. Plan for UV wherever there is snow, even when winter temperatures are low.
UV is generally stronger at higher elevations. The weather agency forecasts for a representative elevation in each cell roughly 20 km square. When plains and mountains are in the same cell, this is usually the elevation of the plains. UV can exceed the displayed value in the mountains. Because clouds and other factors also matter, the value is no guaranteed minimum, and elevation alone cannot precisely correct it.
The agency’s average for thin cloud is about 80–90% of the cloudless UV index. Depending on the cloud, the index can even be higher than under clear skies. Airborne particles and the sun’s elevation also matter. A bright white snow photo cannot be classified as a high-UV day, or a darker one as a low-UV day.
The forecast already takes reflection from typical winter snow cover into account in some areas. Check which place and time it applies to before interpreting it. The 80% figure for fresh snow cannot simply be added to the forecast. A photo cannot determine the reflectance of the snow or tell you your exposure simply because the subject is white.
Why photo brightness does not tell you about UV
Nikon’s exposure guide defines exposure as the amount of light reaching the image sensor and explains that exposure compensation can change how bright the picture is. White subjects are affected by automatic exposure and camera settings. This explains how a photo is made. Ordinary camera and phone pictures cannot be used as UV meters. Consult your manual for the controls on your model.
If the snow looks similar in photos from a thin-cloud day and a clear day, the pictures cannot tell you whether UV levels were similar. According to the ministry handbook, 80–90% of UV-B passes through thin cloud, so seeing cloud does not necessarily mean substantially less exposure. A darker photo does not show weaker UV either. Changing the screen brightness changes the image you see and has no effect on the exposure you received on the hike.
Use photos to record when and where you took them and which way you faced. Keep that separate from information on the intensity of UV. Adjust camera settings to make an image easier to read. They cannot help you assess the UV level. Give the two kinds of information separate fields so you can tell them apart later.
Make a one-sheet sunlight record at home
The editors suggest trying this one-page format at home. Its effectiveness has not been tested. Set up the sheet and practice reviewing it before going out. Use four fields: official data, on-site observations, photography and what you felt.
In official data, record the weather-adjusted and clear-sky forecasts for the date of the hike, the area, the forecast time and the issue time. If comparing archives, distinguish station observations from calculated analyses and match the location and indicator. Values such as an hourly forecast and a monthly average of daily peaks mean different things and cannot be compared directly.
In on-site observations, briefly note date, time, location, snow, clouds and shade at a safe rest spot. As the weather agency’s explanation of scattered radiation and the ministry’s guidance show, some UV reaches the shade. Time spent there helps you review the hike. Avoid calculating your UV dose using a fixed figure such as “shade cuts it in half.”
In photography, note the date, time, direction and scene, and add settings such as exposure compensation if useful. In what you felt, note glare or warmth on the skin and keep that apart from UV measurements. If you have concerning symptoms affecting your skin or eyes, seek medical advice instead of attributing them based on photos alone. An absence of symptoms does not mean protection was unnecessary. Check the conditions and equipment for your next hike afresh.
In short: keep separate records for photos and UV
Photo or screen brightness cannot indicate UV intensity. Use photography to record the scene, and plan UV protection using information for the area and hours of the hike along with conditions on site. Notes do not measure individual exposure. On snow, combine clothing, a hat, sunglasses and sunscreen.
References and sources
- Japan Meteorological Agency: What Is the UV Index?
- Japan Meteorological Agency: Guide to UV Information
- Japan Meteorological Agency: UV Data Archive
- Japan Ministry of the Environment: UV and Environmental Health Handbook 2020
- Japan Meteorological Agency: Clouds and Ultraviolet Radiation
- Nikon: Lesson 10 — Exposure